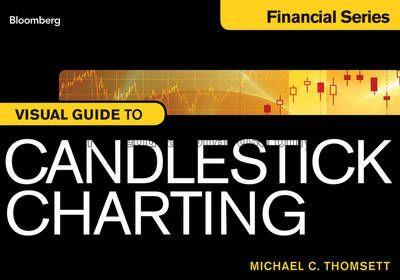
Candlestick charts are an effective way of visualizing price movements and, due to the increased interest in the complex derivatives market, they are being used more and more widely. A combination of a line-chart and a bar-chart, where each bar represents the range of price movement over a given time interval, candlestick charts are most often used in technical analysis of equity and currency price patterns. A guide to the most used charts, The Bloomberg Visual Guide to Candlestick Charting is arranged in an easy-to-use manner, providing a quick reference for those new to the field. Candlestick charts are formed with the help of the opening, high, low, and closing price of the day—if the opening price is above the closing price then a filled candlestick is drawn, and these charts are visual aids for decision making in forex, stock, commodities, and options trading
| Barcode | Call No. | Volume | Status | Due Date | Total Queue | |
|---|---|---|---|---|---|---|
| 1010082380 | IK00214 |
Available |
0 | Please Login | ||
| 1010078325 | IK00214 |
Available |
0 | Please Login |